Patrick Crowley
Head of Sales & Operations


Rex Kehoe
Director of Installers
Solar Energy in U.S. – Key Facts for 2019
May 3, 2019
In today’s livestream, Patrick and Rex talk about the U.S. Solar Power and cover interesting facts stated in “U.S. Solar Market Insight” – a quarterly publication from Solar Energy Industries Association (SEIA) and Wood Mackenzie Power & Renewables. This report offers high-quality and solar-specific analysis by gathering complete information of the U.S. solar market industry trends in 2018, through comprehensive surveys of installers, manufacturers, utilities, and state agencies.
2018 Highlights of Solar Energy in the U.S.
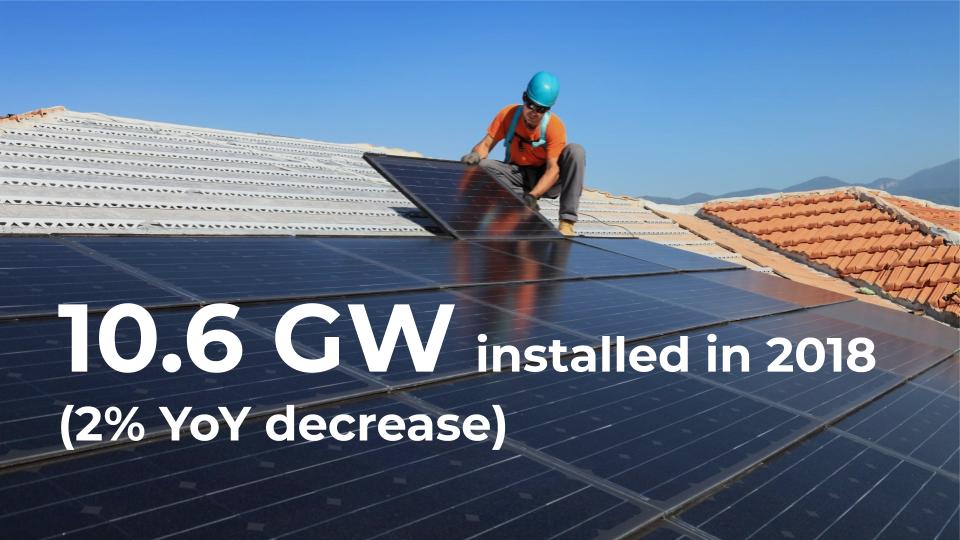
- In 2018, 10.6 gigawatts (GWdc) of solar photovoltaic capacity was added to the U.S. solar market. When compared to 2017, the previous year saw a 2% decrease in PV capacity additions.
- Unlike the 15% decrease in 2017, 2018 has seen an increase of 7% in the residential market. The trend is reversed in non-residential PV that saw an annual decline of 8%.
- With the impacts of Section 201 tariff, utility solar also experienced a slight annual decrease.
- Overall, in 2018, solar has accounted for 29% of new electricity generating capacity additions. For six years straight, solar is recorded as the second most preferred source for new electricity capacity.
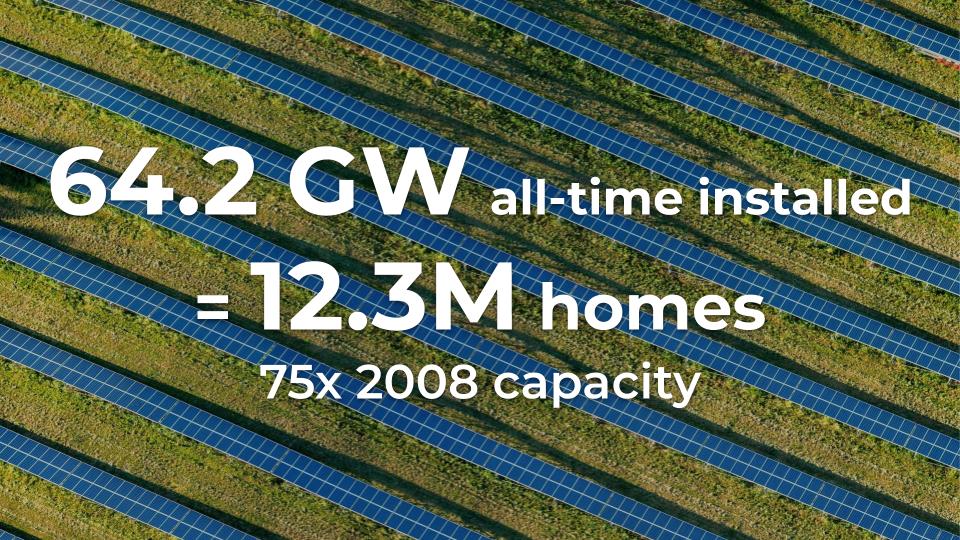
- There are now 64.2 GW of installed solar capacity in the U.S. which is enough to power more than 12.3 million American homes. This is 75% more compared with the PV capacity installed in 2018. Factors like technological advancements, better awareness of solar among people, and effective financing methods have significantly improved the solar capacity in the U.S. in the past decade.
Residential PV Market – 2018
- In 2018, a total of 314,600 new residential PV systems were installed which is 8% more than that of 2017. Q4 has the maximum residential PV systems installed in two years.
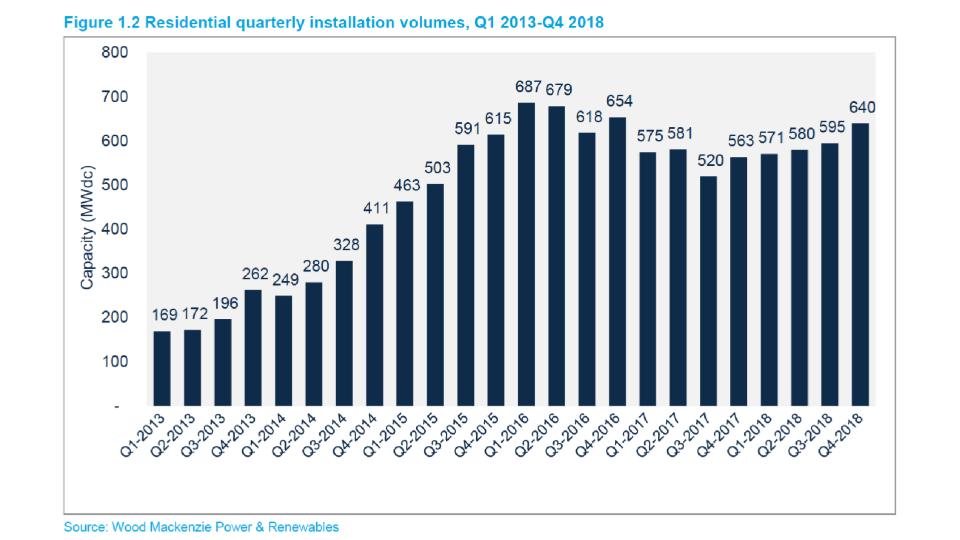
- Looking at the five quarters of moderate industry growth, the market is now adopting a more sustainable growth profile with a mix of local and regional installers operating alongside national installers.
- High costs of customer acquisition are still considered as a constraint to the residential PV market.
Non-Residential PV Market – 2018
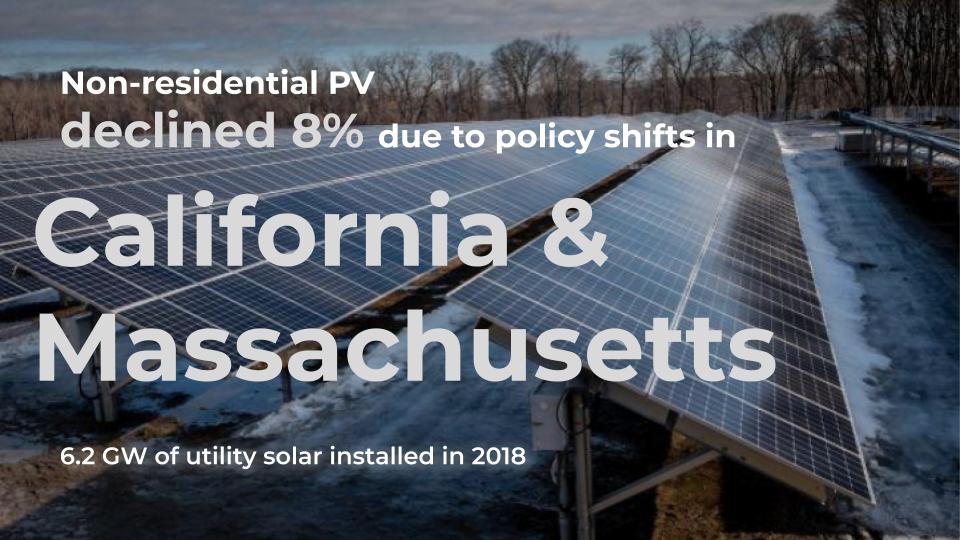
- With state-specific regulatory and policies, non-residential PV has seen an 8% decrease in 2018.
- The effect of new policies can be seen in the major markets of California and Massachusetts. California has seen a 17% YoY decrease in the non-residential PV market. However, this decline was not as drastic as assumed.
- However, Massachusetts saw a 64% YoY decline in non-residential PV capacity installed. This decline is caused by the industry awaiting the start of the Solar Massachusetts Renewable Target (SMART) program by the end of November 2018.
U.S. Solar Market in 2019
- With over 12 GW of installations expected, the study forecasts 14% growth in 2019.
- Prior to the expiration of the residential Federal Investment Tax Credit (ITC), with annual installations reaching 15.8 GWdc, the total installed U.S. PV capacity is expected to be more than double over the next five years. This is followed by a drop in the commercial tax credit to 10% for projects not yet under construction. By verifying all these numbers from SEIA and Wood Mackenzie study, it is admitted that now is a better time for going solar than ever before.